Why bother to tell a story visually?
Visual storytelling can make complex ideas and stories easier to understand – which makes the message at the heart of it far more impactful. There’s a lot of science to back this up, but here are some quick statistics from Shift E-Learning:
- 90% of information transmitted to the brain is visual
- Visuals communicate information 60,000 times faster than text
- Research has found that 65% of the general population are visual learners, meaning they need to see information in order to retain it
With that in mind, adding visual richness to any event or experience you’re organising makes it easier for you to land your messaging and encourage attendees to keep thinking about it long after they’ve left.
This is where graphic recording comes in.
What is graphic recording?
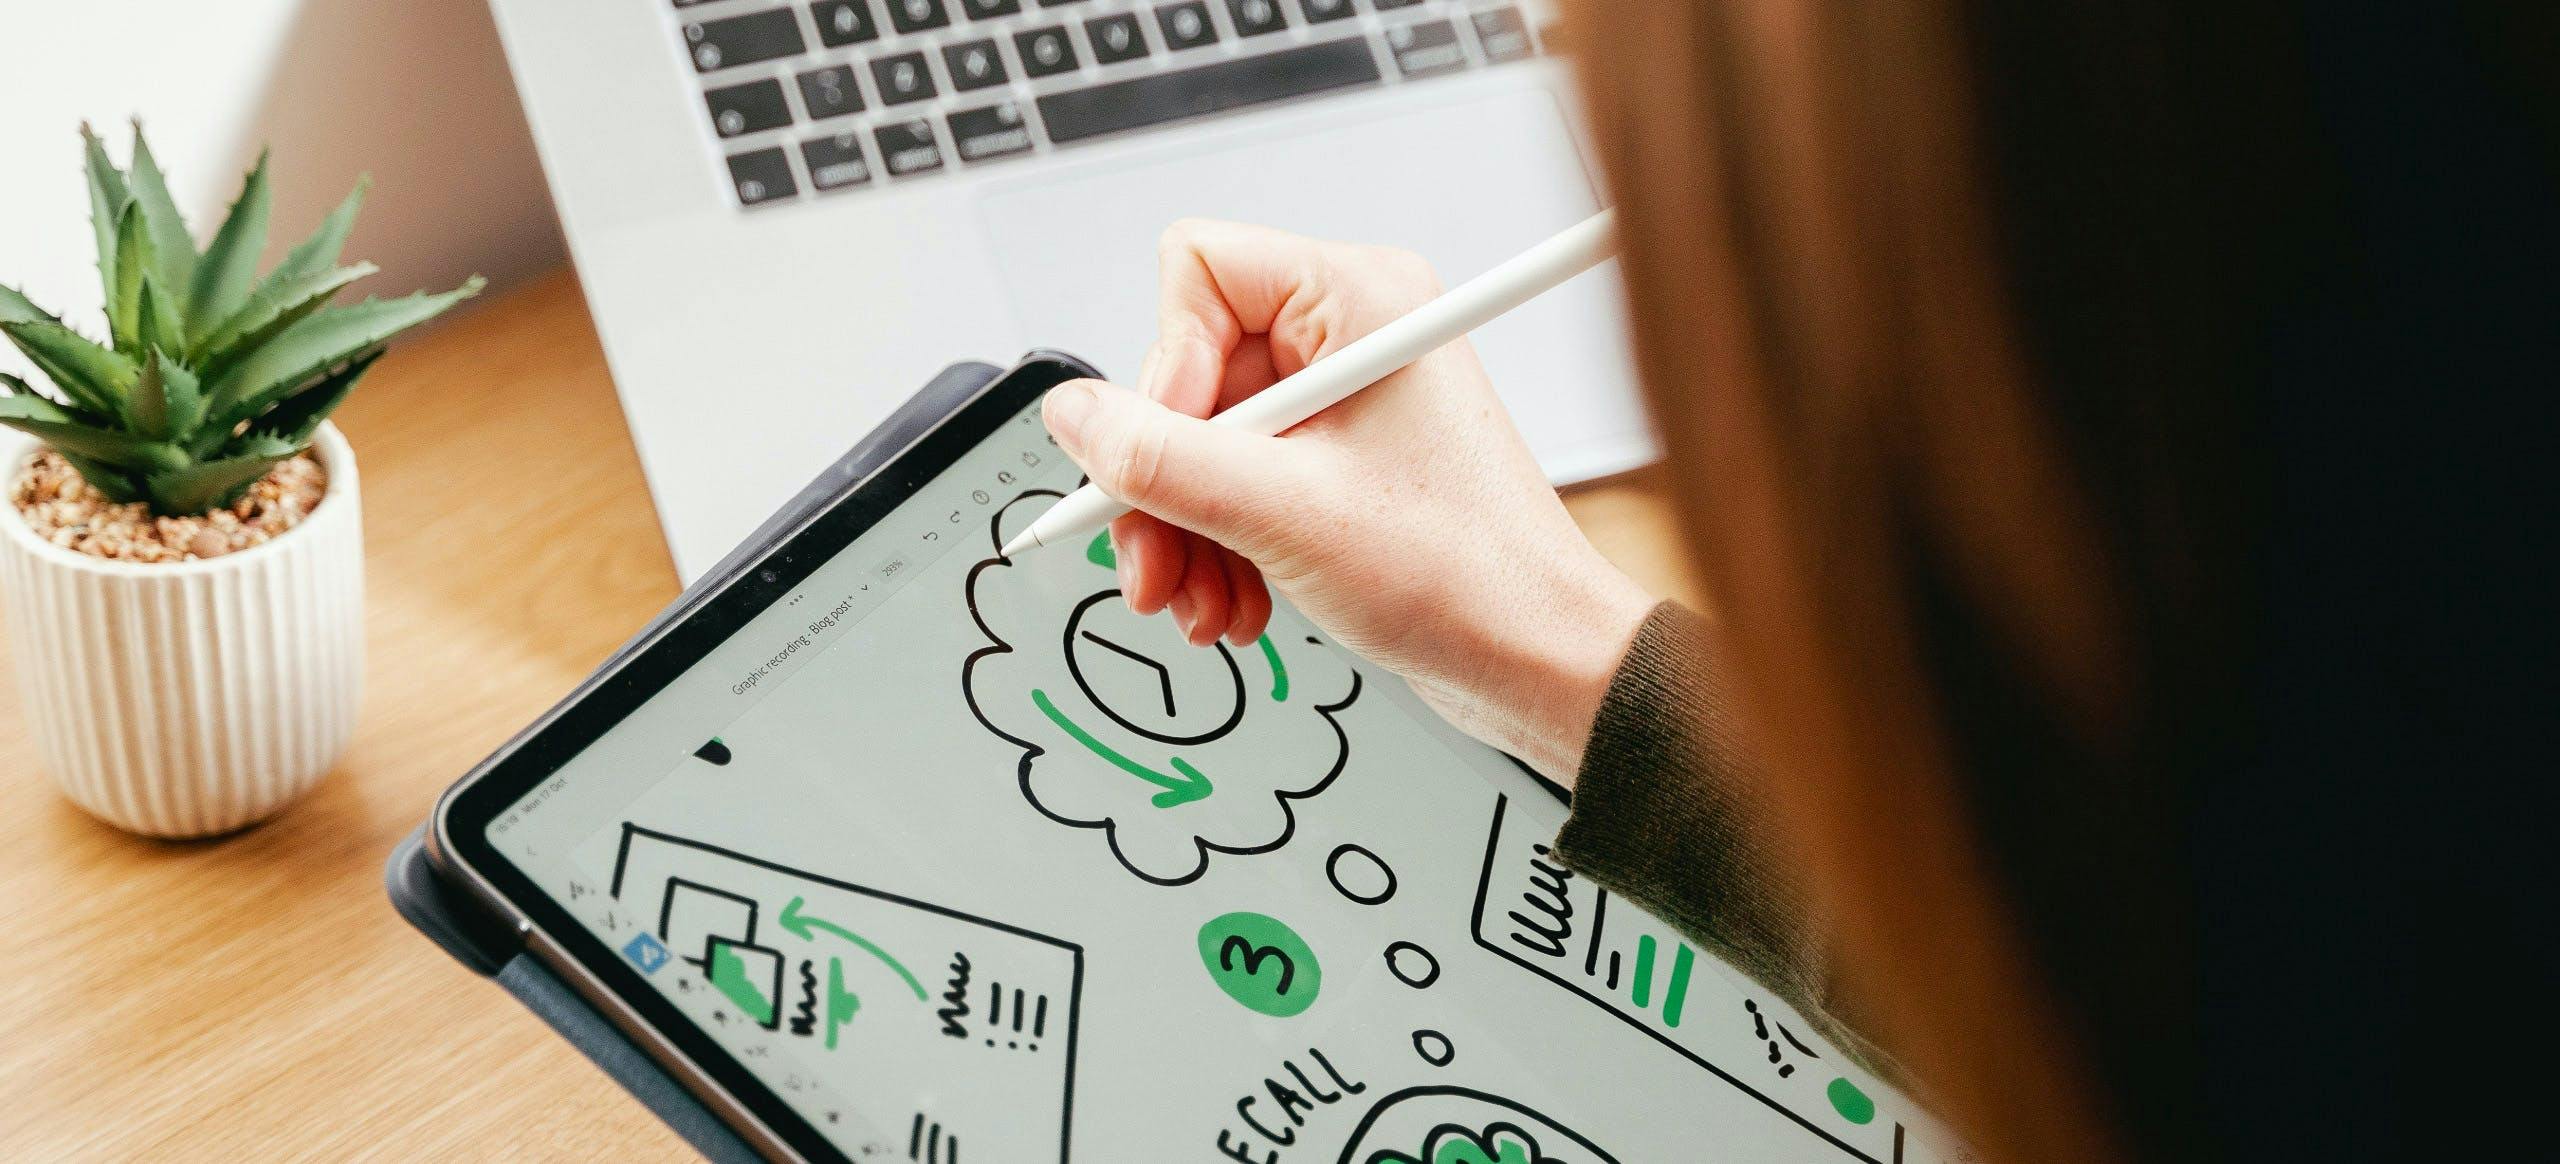
Often used during workshops, meetings, events and conferences, graphic recording is where an artist takes ‘visual notes’ during discussion. They listen, synthesise and translate what’s being talked about into drawings done in real-time, helping to keep the conversation flowing and creating a record of your ideas in an impactful, creative way.
The bikablo approach to graphic recording
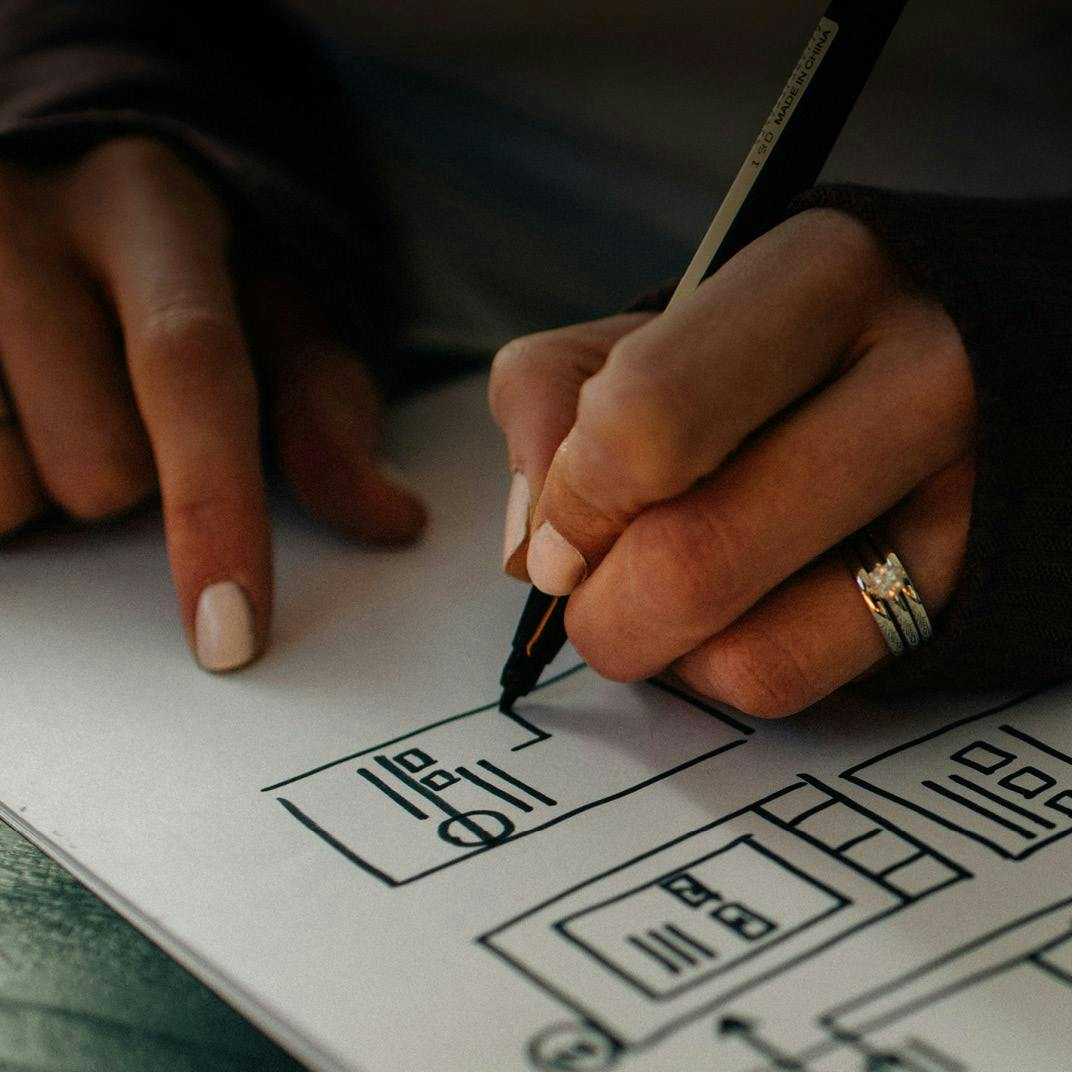
I recently took part in a bikablo two-day training course to develop my graphic recording skill set. The bikablo technique is a step-by-step process that guides learners through the basics of visual language for use in visual thinking, communication, facilitation and collaboration events.
The course teaches how to use text containers and arrows to connect elements and draw attention to key learnings; how establish a toolkit of go-to icons and symbols to build a visual dialogue; and tips and tricks based around colour to support the overall message and structure.
It was a fascinating first look into the world of graphic recording – and it set me up perfectly for the first of our graphic recording events.
How we’ve been using graphic recording for bp Events
We’ve recently dived head-first into the world of graphic recording at three of bp’s Leadership events, here in the UK and overseas in Istanbul.
At each event, we’ve supported their global leadership teams by recording their thoughts and ideas in real time, capturing the key takeaways and overarching themes of discussions as they took shape. Through coaching and our visual aids, they were able to form deeper connections, develop a more supportive culture, and transform the way in which they come up with and collate ideas as a team.
Six reasons to plan graphic recording at your next event:

- It supports the facilitator by keeping audiences energised, engaged and – ultimately – having fun.
- It helps to maximise ideas, enriching communication, strengthening dialogue, and giving structure to thoughts.
- It helps with memory recall. When people hear information, they’re likely to have forgotten 90% of what they learned only three days after they heard it. On the other hand, if a relevant image is paired with that same information, people retain 65% of the information over the same time period.
- It makes ideas more accessible – using a visual framework to cut through complexity brings clarity to ideas and solutions.
- The content that comes from it is evergreen. The array of illustrations created for each session can be shared after the event via email or even on social channels, so the event stays relevant long after it‘s finished.
- It humanises stories, helping participants feel they are being heard. Their thoughts are recorded in real time, so they’re continuously involved in the discussion and can see a physical representation of their contributions.
Want to bring graphic recording to your next meeting, event or workshop? We’d love to hear from you.
To read more, see how we used visual storytelling to create a story of energy for S&P.
Cookies
By clicking "Allow Cookies", you agree to the storing of cookies on your device to enhance site navigation, analyse site usage, and assist in our marketing efforts. By using this site you are agreeing to ourCookie Policy.